



Contribution Margin per SKU: How E-commerce Sellers Evaluate Product Profitability

Highlights
- Unlike ROAS or gross margin, contribution margin includes all variable costs, ads, platform fees, fulfillment, giving a complete picture of unit economics
- Referral fees, logistics, and advertising can reduce margins far more than expected, especially on platforms like Amazon and TikTok Shop
- High-margin products can support higher ad spend, making them ideal candidates for aggressive growth and expansion
- Understanding SKU-level profitability helps allocate inventory, pricing, and marketing budgets more effectively
- While lenders evaluate broader business performance, strong contribution margins reflect operational discipline and sustainable growth potential
- CrediLinq’s line of credit enables ecommerce brands to scale high-margin SKUs by funding inventory and ad spend in line with real cash flow cycles
Why This Matters
- Metrics like ROAS and CAC measure efficiency, but don’t reflect actual profitability at the SKU level
- Contribution margin per SKU accounts for all variable costs, giving a true picture of unit economics
- Marketplace fees, fulfillment, and advertising can significantly erode margins despite strong revenue growth
- Strong SKU-level profitability enables better pricing, inventory, and marketing decisions
- For scaling brands, contribution margin is a key indicator of capital efficiency and sustainable growth
- Lenders and financing platforms evaluate broader performance, but healthy unit economics signal operational discipline and financing readiness
Why Contribution Margin Matters More Than ROAS
High-growth e-commerce sellers often rely on metrics such as return on ad spend (ROAS) and customer acquisition cost (CAC) to guide decision-making. These metrics are useful for evaluating marketing efficiency, but they do not answer a more fundamental question: Does each product generate meaningful profit after all variable costs are accounted for?
This gap becomes especially visible in marketplace environments. Sellers operating on platforms like Amazon or TikTok Shop face layered cost structures: referral fees, fulfillment charges, advertising spend, and payment processing fees that collectively absorb a significant share of revenue.
- Amazon referral fees typically range between 8% and 15%
- Advertising can account for 10–25% of revenue in competitive categories
The result is a pattern many operators recognize: strong revenue growth paired with shrinking profitability.
This is where contribution margin per SKU becomes critical as a metric. It reveals how much profit remains from each unit sold after all variable costs are deducted, making it a far more reliable indicator of sustainable growth.
CrediLinq helps e-commerce operators act on strong unit economics, providing flexible working capital that scales with your sales cycles, so you can reinvest in inventory and advertising without waiting for marketplace payouts.
What Contribution Margin per Unit Actually Measures
At a high level, contribution margin per unit answers a simple but critical question:
after all the costs required to generate a sale are paid, how much value does each unit actually contribute to the business?
In financial terms, contribution margin is defined as revenue minus variable costs.
For e-commerce businesses, this distinction is especially important because many of the costs required to make a sale are not optional: they scale directly with each transaction.
In e-commerce, those variable costs typically include:
- Product manufacturing or sourcing
- Marketplace referral or commission fees
- Fulfillment and logistics
- Advertising cost per sale
- Payment processing fees – Stripe / PayPal pricing (~1.5–3% blended).
Typical Contribution Margin Benchmarks for eCommerce
Contribution margins vary across categories due to pricing power, competition, and cost structures: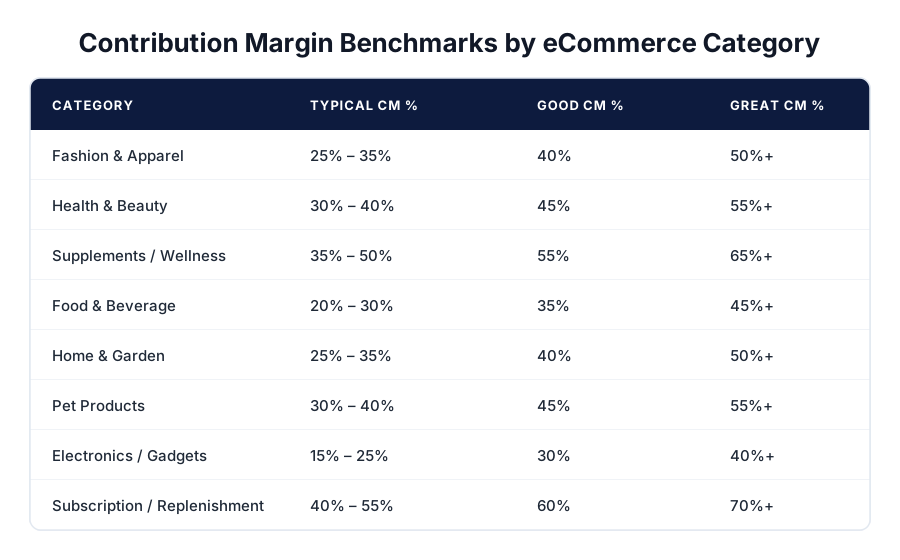
How to Calculate Contribution Margin per Unit
At its core, contribution margin uses a simple financial relationship. To calculate contribution margin per unit, you subtract all variable costs from the selling price:
Contribution Margin per Unit = Selling Price – Variable Costs per Unit
Or expressed in full:
CM per Unit = Selling Price – (Product Cost + Platform Fees + Fulfillment Costs + Advertising Cost per Sale + Payment Processing Fees + Other Variable Costs)
In eCommerce, however, the equation gets more nuanced because variable costs extend well beyond product manufacturing. Every unit sold carries a “cost tail” — fees, ad spend, and logistics charges that move in lockstep with your revenue. Ignoring any one of them inflates your margin on paper and erodes it in reality.
Step-by-Step Breakdown of the Formula
To apply the formula correctly, each input needs to reflect real marketplace behavior — not estimates pulled from a pitch deck.
- Selling Price This is the final price paid by the customer, net of any discounts or promotions you’ve applied. If you run frequent coupons or lightning deals, use your average realized selling price rather than your list price — the difference matters more than most sellers expect.
- Product Cost (COGS) Your manufacturing or landed cost per unit. Landed cost should include the product price, inbound freight, customs duties, and any import taxes. If you’re sourcing internationally, landed cost can run 15–30% above the ex-works factory price once freight and duties are factored in. Always use landed cost here, not just the supplier invoice.
- Platform Fees Marketplaces charge a referral fee on every sale — Amazon’s typically ranges from 8% to 17% of the selling price, depending on the category (e.g., electronics skew lower; personal care and clothing skew higher). On Shopify or other DTC channels, this line item is replaced by your subscription cost amortized per unit, though payment processing still applies separately.
- Fulfillment Costs If you’re using FBA, Amazon charges a per-unit fulfillment fee based on the item’s size and weight tier. As a rough benchmark, standard-size items commonly fall in the $3.00–$6.50 range, while oversized items can exceed $10+ per unit. For FBM or 3PL fulfillment, use your actual pick-pack-ship cost. Don’t forget to include inbound shipping to the warehouse and any storage fees if inventory sits for extended periods — these are still variable at the SKU level if you track them correctly.
- Advertising Cost per Sale (ACoS / Blended CAC) This is where contribution margin calculations most often go wrong. Your advertising cost per unit sold is your total ad spend divided by the number of units that spend generated. On Amazon, this maps to your ACoS (Advertising Cost of Sales). Average ACoS across categories typically falls between 20% and 35%, though competitive categories like supplements or home goods can push well above that. For DTC brands on Meta or Google, use your blended Customer Acquisition Cost (CAC) allocated per unit. The key principle: if you stopped advertising, most sales would stop too, so this is a variable cost, not a fixed one.
- Payment Processing Fees Every transaction carries a processing fee, regardless of channel:
- Stripe: ~2.9% + $0.30 per transaction (standard)
- PayPal: ~2.9% + $0.30 per transaction (can vary by region and volume)
- Amazon Pay / marketplace payments: Often bundled into referral fees, so avoid double-counting
- Blended average: Across providers and geographies, most sellers land in the 1.5%–3.0% range, with higher rates on international transactions and lower rates negotiated at volume
For sellers operating across multiple channels, it’s worth calculating a blended effective rate from your actual monthly statements rather than using headline rates.
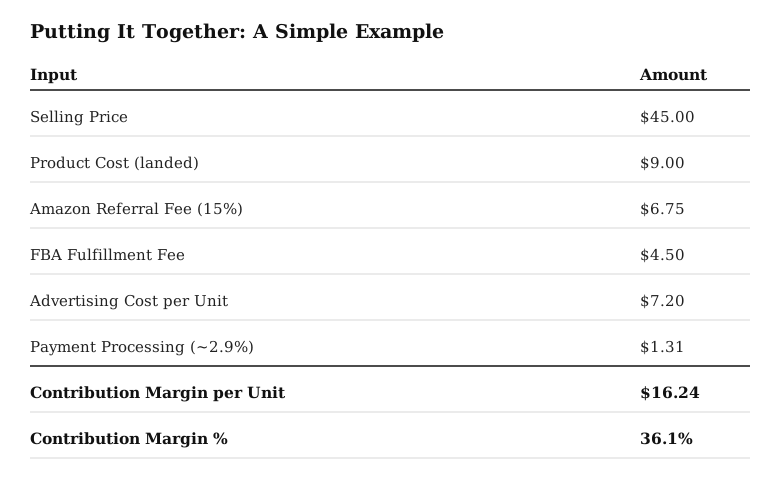
In this example, even though the gross margin on the product itself looks healthy (~80% on product cost alone), the true contribution margin percent after marketplace costs drops to just over 36%. This is the number that actually tells you whether scaling this product creates profit or just creates more revenue with the same thin (or negative) return underneath it.
Contribution Margin Calculator (Interactive Tool)
Instead of calculating this manually for each SKU, you can use this interactive tool:
Use it by inputting:
- Selling price
- Total variable costs (combined)
The tool allows you to:
- Adjust pricing and costs
- Model ad spend increases
- Test discounting impact
- Compare SKU profitability
This is especially useful when managing multiple SKUs or planning scale.
Contribution Margin vs Gross Margin
Before comparing the two, it’s important to recognize that while both are profitability metrics, they operate at different layers of the cost structure.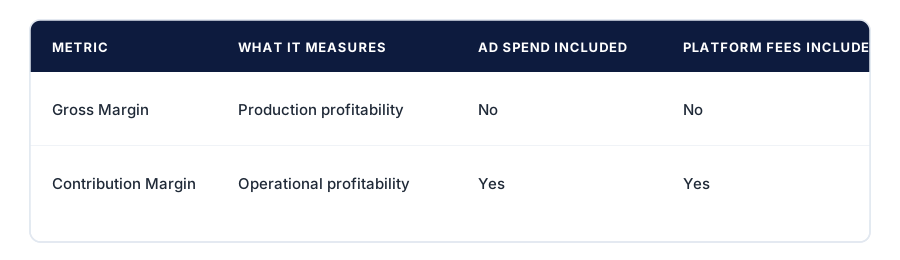
Why Gross Margin Can Be Misleading
Gross margin only considers product cost.
This makes it useful for evaluating production efficiency, but incomplete for e-commerce.
Contribution margin reflects true operational profitability because it includes all costs required to actually make a sale.
In practical terms:
- Gross margin helps determine “Can I produce this profitably?”
- Contribution margin defines “Can I sell and scale this profitably?”
Here’s a scenario to illustrate how gross margin is not the best metric to track:
Example:
- Selling price of a handheld vacuum cleaner: $40
- Product cost: $12
The Gross Margin here is 70%
But after including:
- Referral fees (8–15%)
- Ads (10–25%)
- Fulfillment (10–20%)
- Payments (~1.5–3%)
The Contribution Margin drops to ~25%
What This Gap Means
This difference explains why many e-commerce businesses:
- Grow revenue but struggle with cash flow
- Scale ads but see diminishing returns
- Appear profitable but lack reinvestment capacity
While gross margin shows potential profitability, contribution margin shows actual scalability.
Using Contribution Margin to Drive Decisions
Contribution margin becomes actionable when used to guide decisions across the business. It connects pricing, marketing, and cost structure into a single operational lens.
1. Scaling High-Margin SKUs
High-margin products provide the flexibility to scale aggressively because they can absorb higher customer acquisition costs (CAC) while remaining profitable.
In paid acquisition environments, CAC is rarely static. As competition increases, costs per click and cost per acquisition tend to rise over time, a trend widely observed across digital advertising platforms.
Products with strong contribution margins create a buffer against this volatility. They allow sellers to:
- Increase bids without immediately eroding profitability
- Expand into new geographies or channels
- Sustain growth even as ad costs rise
In contrast, low-margin products often hit a “scaling ceiling,” where additional ad spend no longer generates profitable returns.
2. Pricing Optimization
Contribution margin also acts as an early warning system for pricing inefficiencies.
When margins begin to compress, the underlying drivers are typically one (or more) of the following:
- Underpricing: Products may be priced too conservatively relative to perceived value or competitor benchmarks
- Rising fulfillment costs: Shipping, storage, and last-mile delivery costs fluctuate based on size, weight, and fuel dynamics
- Inefficient advertising: Poor targeting or declining conversion rates increase cost per acquisition
Because most of these costs are variable, even small changes can materially impact profitability. For example, a 5–10% increase in fulfillment or ad costs can significantly compress margins if pricing remains unchanged.
By monitoring contribution margin consistently, operators can make targeted adjustments, whether through price increases, supplier renegotiation, or campaign optimization, before profitability deteriorates further.
3. Advertising Allocation
Perhaps the most immediate application of contribution margin is in deciding where to allocate advertising spend.
Not all revenue is equally valuable. Two products generating the same sales volume may contribute very differently to profitability depending on their cost structure.
Effective allocation prioritizes SKUs with:
- Strong contribution margins
- High conversion rates
Conversion rate benchmarks vary by category, but e-commerce averages typically range between 2% and 4%, with top-performing products significantly exceeding this range:
When high-margin products are paired with strong conversion performance, they create a compounding effect:
- Lower cost per acquisition
- Higher profitability per sale
- Greater reinvestment capacity
This is where contribution margin becomes directly tied to capital efficiency. Instead of spreading ad spend evenly across a catalog, businesses can concentrate resources on the SKUs that generate the highest economic return.
CrediLinq enables e-commerce sellers with flexible credit lines up to $2M so that capital is deployed toward your best-selling SKUs.

Building an E-commerce ROI Framework
On its own, contribution margin provides a clear view of unit-level profitability. However, e-commerce businesses rarely operate on single-product economics alone. Growth, risk, and capital efficiency are shaped by how multiple SKUs perform together over time.
This is where contribution margin becomes significantly more powerful when combined with broader operating metrics that capture demand patterns, revenue stability, and portfolio structure. Together, these inputs form a more complete e-commerce ROI framework, helping founders move beyond isolated profitability and toward sustainable, system-level performance.
In practice, experienced operators evaluate contribution margin alongside four key signals:
1. GMV Trends (Revenue Quality, Not Just Growth)
Gross Merchandise Value (GMV) tracks total sales processed through a platform, but its real value lies in understanding how that revenue evolves over time.
- Is growth consistent or driven by short-term promotions?
- Are sales increasing alongside stable margins, or masking a decline in profitability?
GMV is widely used as a top-line metric across e-commerce platforms.
However, GMV alone can be misleading if not paired with contribution margin. A business can grow GMV rapidly while simultaneously eroding profitability through higher discounts, rising ad spend, or increasing platform fees.
The combination of GMV + contribution margin helps answer a more useful question:
Is revenue growth translating into actual economic value?
2. Sales Velocity (Inventory Efficiency and Cash Flow Timing)
Sales velocity measures how quickly products sell over a given period. It directly impacts:
- Inventory turnover
- Working capital cycles
- Storage and holding costs
Amazon defines inventory performance as a key operational metric for sellers.
High sales velocity typically indicates:
- Strong product-market fit
- Predictable demand
- Faster cash conversion cycles
Low velocity, even with healthy margins, can tie up capital in unsold inventory—reducing overall return on investment.
When paired with contribution margin, sales velocity helps identify which profitable products are also capital-efficient.
3. Seasonality Patterns (Demand Volatility and Planning Risk)
Many e-commerce categories experience significant seasonal fluctuations. Shopify highlights how seasonal demand affects sales cycles and forecasting. A few categories include:
- Apparel (festive seasons, weather shifts)
- Electronics (holiday sales cycles)
- Beauty (campaign-driven spikes)
Understanding these patterns is critical for inventory planning and cash flow management.
Without accounting for seasonality:
- Inventory may be overstocked during low-demand periods
- Advertising spend may be mistimed
- Cash flow gaps may widen between inventory purchase and revenue realization
Contribution margin alone does not capture timing risk but when combined with seasonality insights, it helps determine when profitability is actually realized, not just whether it exists.
4. SKU Concentration Risk (Revenue Dependence and Fragility)
One of the most overlooked risks in e-commerce is over-reliance on a small number of products.
When a large share of revenue comes from a limited set of SKUs:
- Platform ranking changes can impact visibility
- Inventory disruptions can halt sales
- Competitive pressure can erode margins quickly
This is often referred to as concentration risk in broader financial analysis.
In e-commerce, the implications are immediate and operational.
A business generating 70–80% of revenue from one or two SKUs may appear successful, but it is structurally fragile. A single disruption, stockout, policy change, or demand shift can materially impact cash flow.
Diversifying across multiple profitable SKUs (not just multiple SKUs) reduces this risk and stabilizes revenue streams.
Where Operations Meet Financing
These four metrics, GMV trends, sales velocity, seasonality, and SKU concentration, extend contribution margin into a broader framework that reflects not just profitability, but resilience. This is increasingly important in the context of financing.
Modern e-commerce-focused lenders do not evaluate businesses solely on revenue scale. Instead, they assess:
- Revenue consistency over time
- Predictability of cash flow
- Operating history across channels
In other words, financing decisions are closely tied to how stable and repeatable a business’s performance is, not just how fast it is growing.
Contribution margin provides the foundation for this analysis, while the surrounding metrics determine whether that profitability is durable.
Together, they form a practical ROI framework: one that aligns operational decisions with long-term capital efficiency and financing readiness.
Portfolio Management Using Contribution Margin
Once the contribution margin is calculated across a product catalog, it becomes a practical tool for portfolio management: not just a financial metric. At this stage, the goal shifts from understanding individual SKU profitability to making coordinated decisions across the entire product mix.
In e-commerce, resources such as advertising budgets, inventory capital, and operational bandwidth are finite. Allocating them efficiently requires a structured way to evaluate which products deserve investment, which need optimization, and which may be holding the business back.
One widely used approach is a simple two-variable framework that combines:
- Contribution margin (profitability)
- Sales velocity (demand and turnover)
This mirrors broader portfolio thinking used in business strategy (e.g., growth-share matrices), adapted for e-commerce unit economics.
Decision Framework: Margin × Velocity
To translate contribution margin insights into clear, repeatable actions across your product catalog, it helps to map each SKU against demand (sales velocity) and profitability using a simple decision framework: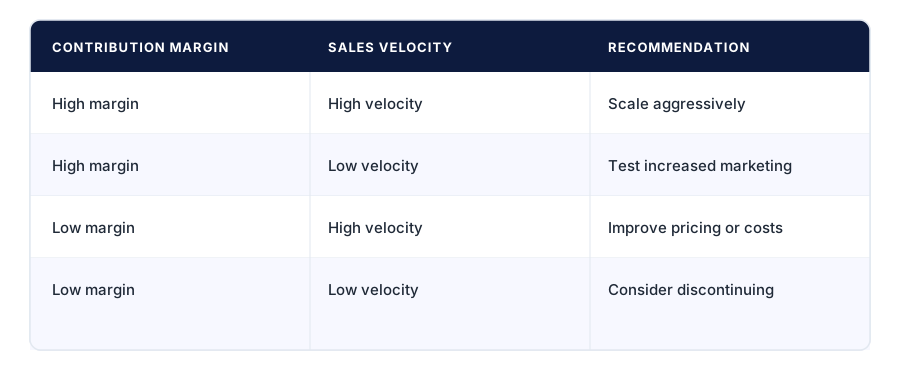
- High Margin + High Velocity – Scale Aggressively
These are your strongest SKUs: they combine profitability with demand.
Characteristics:
- Strong conversion rates
- Efficient CAC relative to margin
- Fast inventory turnover
These products are typically the best candidates for:
- Increased ad spend
- Inventory expansion
- Entry into new marketplaces
Because they generate both cash flow and volume, they often become the core drivers of growth.
- High Margin + Low Velocity – Test Increased Marketing
These products are profitable but underexposed.
The issue is usually not economics, but demand generation:
- Low visibility
- Weak listing optimization
- Limited ad coverage
In this case, increasing marketing investment can unlock growth without significantly increasing risk, because margins provide a buffer.
Tactics may include:
- Improving product listings (SEO, images, reviews)
- Running targeted ad campaigns
- Leveraging influencer or social commerce channels
Shopify highlights product visibility and merchandising as key drivers of e-commerce performance.
- Low Margin + High Velocity – Improve Pricing or Costs
These are high-demand but economically inefficient products.
They often:
- Drive significant revenue
- Consume disproportionate resources
- Deliver limited profit
This is a critical category because it can create the illusion of success—high sales volume masking weak profitability.
Typical actions include:
- Adjusting pricing (if demand is inelastic)
- Negotiating supplier costs
- Reducing fulfillment expenses (packaging, shipping optimization)
- Improving ad efficiency
Even small improvements in cost structure can have an outsized impact at high volumes.
For example, Amazon FBA fees and logistics costs can materially affect margins depending on product size and weight.
- Low Margin + Low Velocity – Consider Discontinuing
These SKUs neither generate meaningful profit nor contribute to growth.
They often:
- Tie up inventory capital
- Add operational complexity
- Distract from higher-performing products
In portfolio terms, they represent negative ROI assets.
Discontinuing or deprioritizing these SKUs can:
- Free up working capital
- Simplify operations
- Improve overall portfolio efficiency
Inventory optimization is a key lever here: excess or slow-moving inventory directly impacts cash flow and storage costs.
From Analysis to Action
What makes this framework powerful is its simplicity. By mapping every SKU into one of these four categories, founders can quickly translate financial data into clear operational decisions.
More importantly, it ensures that:
- Capital flows toward high-return opportunities
- Underperforming products are actively managed or removed
- Growth is driven by profitable demand, not just volume
In fast-moving e-commerce environments, this kind of structured portfolio thinking is essential. It prevents businesses from scaling inefficiently and helps maintain a disciplined balance between growth, profitability, and capital allocation.
Why Contribution Margin Matters for Financing
As e-commerce businesses scale, growth becomes increasingly capital-intensive. Inventory must be purchased weeks or months in advance, advertising spend must be committed upfront, and expansion into new marketplaces often requires additional working capital before revenue is realized.
This creates a structural timing gap: cash goes out before cash comes in.
To bridge this gap, many e-commerce operators turn to external financing. However, modern financing providers, especially those focused on digital commerce, evaluate businesses very differently from traditional lenders.
What Financing Providers Actually Evaluate
Instead of relying solely on collateral or static financial statements, e-commerce-focused lenders assess operational performance signals that reflect how the business generates and sustains revenue:
1. Revenue Consistency
Lenders look for sales and transaction history over time, typically 12+ months.
Consistent revenue indicates:
- Reliable demand
- Repeatable performance
- Lower risk of default
2. Marketplace Payouts and Cash Flow Visibility
Marketplace businesses operate on payout cycles (e.g., Amazon disbursements every 7–14 days), which directly affect liquidity.
Lenders analyze:
- Frequency and stability of payouts
- Cash flow gaps between inventory purchase and payout
This helps determine whether a business can comfortably service financing while continuing to operate.
3. Multi-Channel Activity
Lenders also check whether you sell across multiple platforms (e.g., Amazon, Shopify, TikTok Shop) before deploying or approving capital.
Multi-channel commerce reduces dependency on a single platform and diversifies revenue streams.
For lenders, this translates into:
- Lower platform risk
- More stable revenue base
- Greater operational flexibility
4. Operational Discipline
This is where contribution margin becomes especially relevant.
Operational discipline includes:
- Cost control across ads, fulfillment, and fees
- Efficient inventory management
- Clear visibility into SKU-level profitability
While lenders may not explicitly ask for “contribution margin per SKU,” they are effectively evaluating the outcomes it drives.
Where Contribution Margin Fits In
Contribution margin underpins all of the above signals because it determines whether revenue translates into usable cash flow.
A business may show:
- Strong revenue growth
- High GMV
- Increasing order volume
But if contribution margins are weak, much of that revenue is consumed by variable costs: leaving limited cash available for reinvestment or debt servicing.
This is why two businesses with similar revenue can have very different risk profiles.
How Strong Unit Economics Improve Financing Outcomes
Businesses that understand and actively manage contribution margin are better positioned to:
Deploy Capital Efficiently
They can direct financing toward SKUs that generate the highest return, rather than spreading capital across the entire catalog.
Avoid Over-Scaling Unprofitable SKUs
Without margin visibility, businesses may scale products that drive revenue but not profit leading to cash flow strain despite growth.
Maintain Stable Cash Flow Cycles
Healthy contribution margins ensure that each sales cycle generates surplus cash, helping bridge the gap between inventory investment and revenue realization.
The relationship between profitability and cash flow sustainability is widely recognized in financial analysis.
Connecting Operations to Capital
At a broader level, contribution margin links day-to-day operational decisions with long-term financial outcomes.
- Pricing decisions affect margins
- Margins affect cash flow
- Cash flow affects financing eligibility
This creates a feedback loop: businesses with strong unit economics tend to qualify for better financing terms and are able to deploy that capital more effectively.
CrediLinq’s line of credit is built for e-commerce operators, providing flexible capital that scales with your revenue cycles, so you can double down on high-margin SKUs without liquidity constraints.
With CrediLinq, you can:
- Access up to $2 million in flexible working capital
- Get approved in as little as 1 business day
- Pay a flat service fee starting at just 1.5% per month, or a simple fixed annual percentage rate (APR) of 18% on the amount used
- Choose repayment terms of 3 to 6* months
- Skip the lock-ins, equity dilution, and early repayment fees
- Transact in multiple currencies—USD, GBP, and SGD
*Customized solutions are available upon request. Loan tenors can extend up to 12 months on a case-by-case basis.
Fund your high-profit SKUs, keep campaigns running, and maintain uninterrupted growth momentum.

Final Takeaways
- Unlike ROAS or gross margin, contribution margin includes all variable costs, ads, platform fees, and fulfillment, giving a complete picture of unit economics
- Referral fees, logistics, and advertising can reduce margins far more than expected, especially on platforms like Amazon
- High-margin products can support higher ad spend, making them ideal candidates for aggressive growth and expansion
- Understanding SKU-level profitability helps allocate inventory, pricing, and marketing budgets more effectively
- While lenders evaluate broader business performance, strong contribution margins reflect operational discipline and sustainable growth potential
- Platforms like CrediLinq enable e-commerce brands to act on these insights, providing working capital aligned with cash flow cycles so high-margin SKUs can be scaled without liquidity constraints
FAQs
1. What is a good contribution margin for e-commerce?
A good contribution margin typically ranges from 30% to 60%, depending on the category. Lower-margin categories like electronics may operate below this range.
2. How do discounts affect contribution margin?
Discounts reduce revenue per unit while most variable costs remain fixed, which directly lowers contribution margin and can quickly erode profitability.
3. How do you calculate contribution margin per unit?
To calculate contribution margin per unit, subtract all variable costs, including product cost, platform fees, fulfillment, advertising, and payment processing from the selling price per unit.
4. What is the difference between contribution margin and gross margin?
Gross margin excludes costs like advertising and platform fees, while contribution margin includes them, making it a more accurate measure of profitability.
5. How should bundles be treated in contribution margin calculations?
Bundles should be evaluated as a single unit by combining total revenue and total variable costs across all included products.
6. How does contribution margin relate to debt financing?
Contribution margin reflects unit-level profitability, which supports stronger financial discipline and operational performance: factors that indirectly strengthen financing readiness.