Highlights
- The global swimwear market is valued at $22.4 billion, growing toward $34.2 billion by 2032, and Amazon is one of its fastest-growing channels.
- UPF clothing and UV protective clothing ecommerce is growing at 8.97% CAGR globally. Consumers are treating sun protection as a daily habit, not a beach-day purchase, making UPF clothing amazon FBA one of the most durable growth plays in summer apparel.
- Women’s swimwear return rates reach 25–35% on ecommerce platforms, compared to 3–7% for most non-apparel categories. Nearly 40% of returned items come back requiring markdown. Return costs must be modelled into unit economics before a season is committed.
- SKU multiplication is the defining operational challenge: a 4-colourway women’s swimwear line with XS–2XL sizing generates 24 or more individual ASINs, each requiring its own inventory depth decision and purchase order line.
- CrediLinq gives ecommerce sellers flexible credit lines up to $2M, approved in under one business day based on store performance data, so summer apparel sellers can commit to the right inventory depth across their full size range, rather than cherry-picking the safest SKUs and leaving margin behind.
Summer apparel is a high-stakes seasonal window
Most apparel categories have relatively stable year-round demand. Swimwear, rash guards, UPF 50+ sun shirts, and beach coverups do not. They follow one of the sharpest demand curves in all of Amazon fashion: a steep ramp from April, a hard peak in June and July, and an abrupt drop by late August that makes unsold inventory worth a fraction of what you paid for it.
For a swimwear Amazon seller, or a seller in the broader UV protective clothing and summer apparel space, this seasonal compression creates both an enormous opportunity and a specific set of operational risks that do not exist in other categories. To capture the full window, sellers must calculate the right inventory depth, across the right size runs, funded early enough to actually be on shelf when demand peaks.
This article is a guide to exactly that.

The sharpest seasonal window in Amazon fashion
The swimwear demand curve is narrow and unforgiving. ShelfTrend’s 2026 Women’s Swimwear Market Analysis documents three distinct purchasing windows, with the combined March–July period representing 62% of annual volume. Peak season — April through July — shows sales running at 165% of annual baseline averages. Off-season drops to 65% of baseline.
The April 2025 month-on-month increase of 68% (as per Google Trends) signals how compressed the buying intent is. Most of the season’s search momentum builds in a 90-day window. For a swimwear Amazon seller or summer apparel ecommerce seller, that means your inventory must already be at FBA before that ramp begins, not during it.
UV protective clothing ecommerce follows a similar but slightly more extended curve. Because UPF clothing is increasingly used for everyday outdoor activity, including hiking, running, outdoor work, travel, rather than purely beach occasions, demand extends further into spring and early autumn. That makes it a more forgiving category than pure swimwear, but inventory planning still needs to front-load for the summer peak.

SKU multiplication strategy for ecommerce sellers
Summer apparel sellers carry far more individual SKUs than most Amazon categories. A single swimwear style requires inventory decisions across every size and colourway combination — each one a separate ASIN with its own demand curve, sell-through rate, and stockout risk.
SKU multiplication: A worked example

73 purchase order lines means 73 individual inventory decisions — each requiring a demand forecast, a reorder point calculation, and a capital allocation. Under-order a popular size in a peak colourway and you lose that sale permanently. Over-order an edge size in a slow colourway and you are holding unsellable inventory past September at a steep markdown.
The size distribution problem
Apparel sellers often stock inventory in rough proportion to average category size distribution — but real-world sales data rarely matches those averages at the ASIN level. A swimsuit that photographs well on a size M model may sell disproportionately in larger sizes because its silhouette resonates with that customer. A UPF shirt marketed for hiking attracts a different size curve than the same shirt marketed for beach use.
Size-weighted inventory allocation formula
Units per Size = (Total Style Units) × (Size % from Prior Season Data or Category Benchmark)
Example — Women’s one-piece swimsuit, 500 total units, benchmark size distribution:
XS: 8% → 40 units | S: 18% → 90 units | M: 28% → 140 units
L: 24% → 120 units | XL: 14% → 70 units | 2XL: 8% → 40 units
First-season sellers: use category benchmark.
Returning sellers: weight toward your own prior-season sell-through data, which sizes sold out first tells you where demand exceeded your forecast.
The cost of size miscalculation compounds quickly. If your size M sells out in the first week of peak season and you cannot restock for 60–75 days, you lose rank on your best-converting size at the exact moment your listing has maximum visibility.
Competitors who stayed in stock capture that demand and build the review velocity you will spend the following season trying to recover.
The cost of return rates in swimwear
Apparel carries the highest return rates of any major ecommerce category — and swimwear sits at the upper end of that range. The average ecommerce apparel return rate was 25% in 2024–2025. Women’s swimwear specifically reaches 25–35% on ecommerce platforms, with one multi-channel brand cited by Eightx reporting women’s swimwear returns hitting 35% — against a blended brand average of 15%.
Amazon’s clothing and accessories referral fee of 17% already reflects the platform’s recognition of apparel’s complexity. For summer apparel seller cash flow planning, return costs are a line item that must sit alongside COGS, fees, and freight — not be treated as an unexpected hit post-season.
Modelling return costs into unit economics
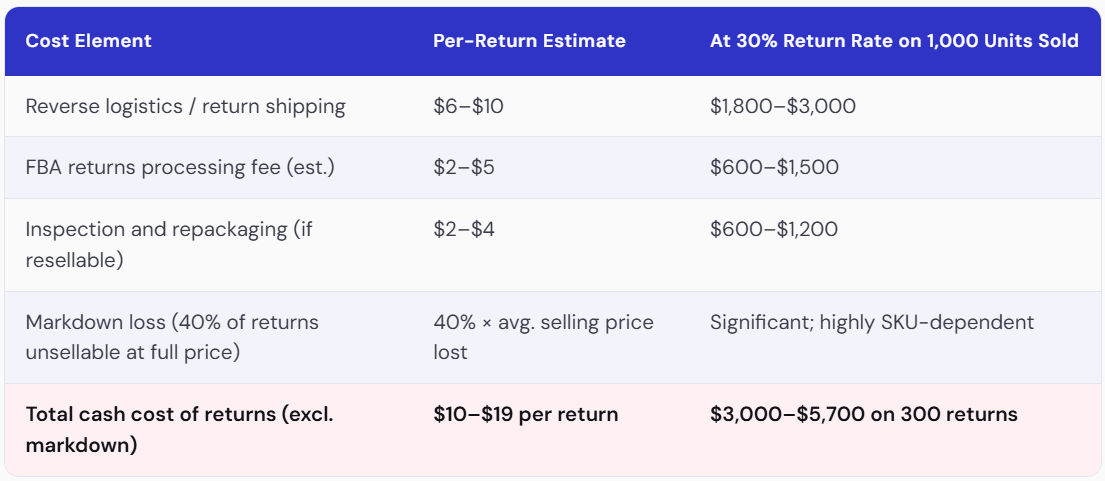
Processing a single return costs between 20% and 65% of the item’s original price when all associated expenses are included. For a $35 swimsuit with a 30% return rate, the blended return cost reduces effective gross margin significantly — which is why size accuracy, listing photography quality, and detailed measurement tables are not optional for Amazon fashion seller financing ROI calculations. They are cost controls.
40–50% of fashion returns stem from expectation mismatch — wrong size, colour differing from image, or fit not as described — according to McKinsey research on retail returns. Sellers who invest in accurate size charts, multi-angle lifestyle photography, and model diversity see return rates 8–12 percentage points below category average. On a 1,000-unit season, that difference is worth thousands of dollars in avoided return costs.
Summer apparel seller cash flow issues
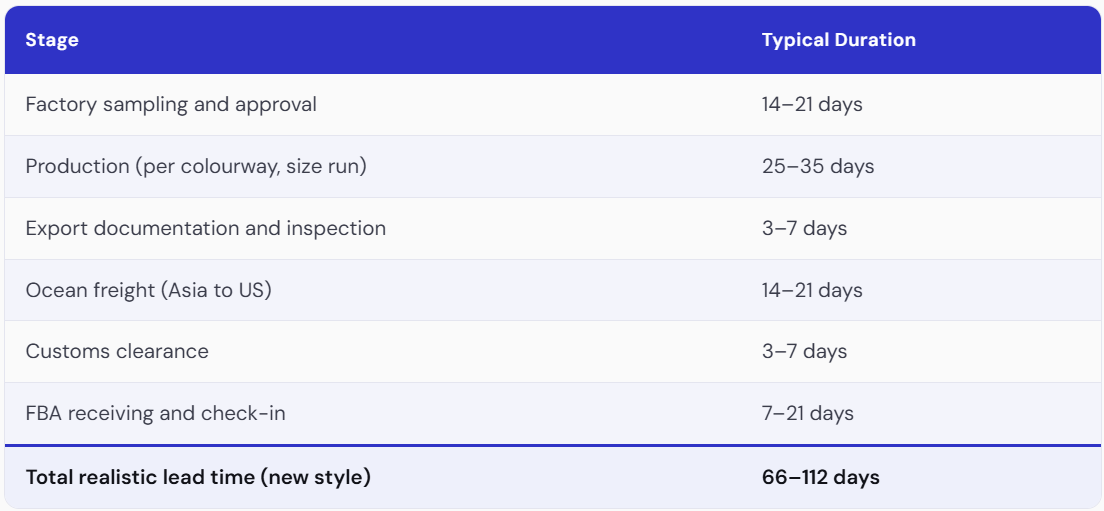
The swimwear Amazon seller inventory challenge is not purely operational — it is financial. Purchase orders for a June peak need to go out in February or March at the latest. Given typical imported apparel lead times of 60–90 days (factory production, freight, customs, FBA receiving), product ordered in April arrives in late June or July — at or past peak.
Real lead time for imported swimwear and UPF apparel
For a May 1 in-stock target on a new style, the purchase order and sample approval process must begin by late January. Most sellers do not have the cash for a full-depth, full-size-range inventory commitment in January, because January revenue reflects November and December sales, held 14 days, and the season has not started generating the capital needed to fund itself yet.
This is the structural gap that determines whether a summer apparel seller commits to the right depth of stock or cherry-picks the safest bets, ordering conservatively in mediums and larges, skipping full size runs, and leaving the demand from XS, XL, and 2XL buyers to competitors who stayed fully stocked.
The cost of under-ordering by size
Take a look at how much revenue is lost from a single size stockout:
Lost Revenue = (Daily Velocity in That Size × Days Out of Stock) × Selling Price
A women’s swimsuit selling at $42. Size L sells 8 units/day at peak. You stocked out of Size L on June 15 and could not restock until July 20 — 35 days.
Lost direct revenue: 8 × 35 × $42 = $11,760
You also lose ranking during stockouts, waste PPC spends on depleted sizes, and suffer potential halo loss across other sizes as listing BSR drops.
A single size stockout during peak season can cost more than the entire season’s inventory investment in that colourway.

UPF clothing: The opportunity within summer apparel
While swimwear demand is sharply seasonal, UPF clothing Amazon is becoming a more year-round business. The global UPF sun protective clothing market was valued at $682M in 2025 and is projected to reach $1.61 billion by 2035 — a CAGR of 8.97%. In the US specifically, the market is expected to reach $1.23 billion by 2030 at 8.4% CAGR.
The shift driving this growth is consumer behaviour: 57% of sportswear consumers prefer clothing with built-in UV protection compared to traditional fabrics, and 64% of outdoor apparel buyers now prioritise protective garments over standard alternatives. Sun protection is no longer a beach-day consideration — it is a daily-use product category, in the same vein as SPF skincare.

The children’s segment is worth highlighting specifically: it is projected to grow at the fastest CAGR of 12% within UPF apparel, driven by parental awareness of skin cancer risk. The WHO reports that approximately 1 in 5 Americans will develop skin cancer by age 70. That statistic is now widely known among parents, and it is translating into purchase intent for children’s sun-protective swimwear at a rate that is growing faster than adult categories.
How to be a seller who wins the season
List 6–8 weeks before peak
Amazon’s algorithm rewards listings with conversion history. A swimwear or UPF clothing listing launched in May competes for placement against listings that have been building reviews and sales velocity since March. Launch your listings by early March for seasonal swimwear and by late February for UPF apparel — give the algorithm 8 weeks of data before peak demand arrives.
Control returns with the right photos
Apparel listings with model photos convert 2–3× higher than flat-lay images. For swimwear specifically, model diversity — showing the same suit across multiple body types and skin tones — reduces return rates caused by “doesn’t look like the photo” and drives cross-size conversion.
Every percentage point of return rate reduction is a direct margin improvement given the $10–$19 cost per return.
Provide exact size charts
40–50% of fashion returns are caused by expectation mismatch around sizing. A detailed size chart with actual garment measurements (not just S/M/L guidance), plus a “how to measure” graphic, reduces the main driver of returns in your category.
For UV protective clothing ecommerce sellers specifically, including fit guidance for UPF coverage (sleeves past wrists, collar height) also reduces returns from customers who expected more coverage than the standard cut provides.
Pre-season seller readiness checklist

The right financing elevates summer sales for ecommerce sellers
The demand for swimwear, rash guards, and UV protective clothing on Amazon is predictable, large, and growing. The calendar is the same every year. The search curves are visible months in advance. The category is not a mystery.
What separates the sellers who fully capture the season from those who partially capture it is almost always depth of stock — and depth of stock is almost always a capital decision made in January or February, before the season feels urgent enough to act on. The seller who funds a partial size run in March because they did not have the cash in February will spend July watching their size M sell out while their size XL and 2XL sit untouched.
For Amazon fashion seller financing, the most effective approach is a revolving credit line — draw for the full purchase order in February, repay from peak-season revenue through July and August, and carry none of the idle interest that comes with a fixed loan sitting unused.
If you are a summer apparel seller who knows what your inventory plan requires but needs the capital to execute it fully, CrediLinq approves credit lines up to $2M in under one business day based on your store’s actual sales data — no collateral, no equity required.
Why CrediLinq Works for Summer Apparel Sellers
Most lenders assess creditworthiness on tax returns and collateral. Neither reflects a swimwear seller with strong sell-through data and a clear seasonal plan. CrediLinq underwrites on real-time marketplace sales, and approves in under one business day. For a seller committing to a full size run in January, that speed is the margin between a complete season and a partial one.

The season is shorter than it looks. Start earlier than feels necessary. Fund the full run.

Key Takeaways
|
Frequently Asked Questions
When does swimwear demand peak on Amazon, and how should sellers plan around it?
Search volume for swimwear peaks between March and June, with the April-to-May period showing the steepest month-on-month growth. Peak season (April–July) accounts for 62% of annual women’s swimwear volume, running at 165% of baseline averages. For a swimwear Amazon seller, inventory needs to be at FBA by end of April at the latest, so purchase orders must go out by January or February given 66–112 day lead times for new styles.
Why is UPF clothing growing so fast, and is it a better opportunity than swimwear for FBA sellers?
The demand for UPF sun protective clothing is driven by consumers treating UV protection as a daily habit rather than a seasonal purchase. For Amazon sellers, the category offers a more extended selling season than pure swimwear. The two categories are complementary, and any summer apparel sellers carry both.
How should summer apparel sellers think about financing their peak-season inventory?
A revolving credit line is the most capital-efficient structure for seasonal apparel inventory. Draw for the full purchase order in January–February, repay from peak-season revenue through July–August, and pay only for the capital you actually use.
What is the right way to allocate inventory across sizes for a new swimwear style?
First-season sellers should use category size distribution benchmarks as a starting point (typically: XS 8%, S 18%, M 28%, L 24%, XL 14%, 2XL+ 8% for women) and allocate units accordingly. For returning sellers, weight allocation toward your own prior-season sell-through data. Which sizes sold out first is the most reliable signal of where demand exceeded forecast.